IELTS Writing Task 1 – Report Writing
Use of energy in an average Australian Household
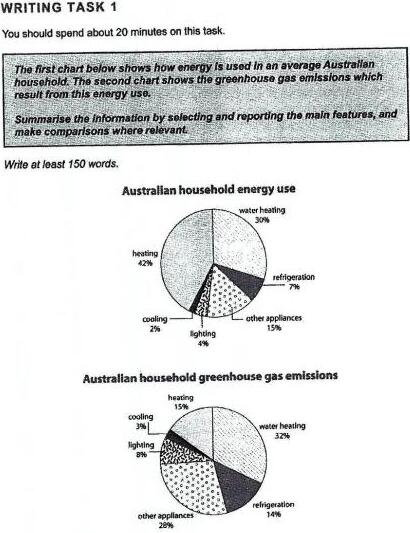
The two pie charts represent the use of energy in various segments of an Australian household and the resultant greenhouse gases as a by-product of that energy use in an unspecified period of time.
Heating and water heating accounted for the highest energy use in an Australian household with 42% and 30% energy usage respectively. Other segments like cooling, lighting and refrigeration’s combined energy utilization was more than one-tenth, whereas other appliances consumed 15% of energy.
Contrary to its energy consumption of less than a-fifth, other appliances produce nearly double the amount (28%) of greenhouse gases. Gas emissions by refrigeration and lighting also increased two-folds to 8% and 14% compared with its energy intake of 4% and 7% respectively. Cooling, on the other hand, produces only 3% of greenhouse gas. Surprisingly, emission of greenhouse gas by heating is significantly lower to 15% in comparison with its energy intake of more than two-fifths.
Overall, it is evident that heating and water heating accounted for major energy use, whereas cooling, refrigeration, lighting and other appliances consumed less energy on average. However, the resultant greenhouses gases are given-off in large amounts by water heating, and other appliances, while cooling, lighting, refrigeration, and heating produce lower amounts of gases.