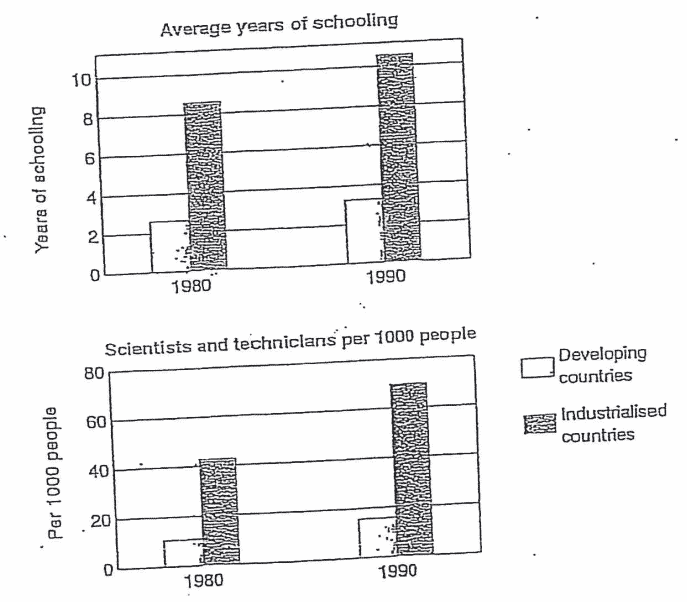
The three bar charts represent average years of schooling acquired, the number of scientists and technicians, and funds spent on research and development (R&D) in developing and industrialized countries in 1980 and 1990.
Overall, it is evident that industrialized countries outpaced the developing countries by a significant margin in all three sectors i.e. average years of schooling, the scientists and technicians produced and spending on R&D. Whereas, the average years of schooling and scientists & technicians produced increased marginally from the start towards the end of the chart period, a decline R&D spending could be witnessed by the end of the period.
In industrialized countries, as the spending on Research and Development increased significantly from around $160 billion in 1980 to nearly $350 billion in 1990, a positive effect could be seen across other sectors i.e. increase in number of scientists & technicians and average years of schooling. In industrialized countries, literacy figures jumped from just over 8 years to over 10 years by 1990. Similarly, slightly more than 40 scientists and technicians per 1000 people were produced in the year 1980 in developed countries, whereas the year 1990 saw a sharp rise to 70 per 1000 people. On the other hand, the spending on R&D in developing countries, which was around $50 billion in 1980, was reduced to around $25 billion by the end of 1990. Contrary to the budget cut in the developing countries, there was a slight increase in the number of scientists and technicians from around 10 per 1000 people to nearly 18 per 1000. Similarly, the average years of schooling also increased from being slightly above 2 years in 1980 to nearly 4 years in 1990.


